Infrastructure Monitoring
As software developers, we like to build cool new things with fun technology and the most cutting-edge techniques. But when applications are released to production, things can get hairy pretty fast. There are plenty of great tools to help you track uptime (Pingdom) or allow you to sift through traffic logs (SumoLogic), but sometimes the infrastructure will cause issues that aren’t readily apparent in these tools. That database query you wrote will misbehave when there’s a lot of data. Your cache will get overwhelmed. Your queue won’t empty fast enough. What is a developer to do?
Something I’ve recently done at my company is to create CloudWatch alarms to monitor various metrics for our AWS infrastructure. Once one of these metrics gets into an alarm state, we are notified via Slack and can address them. It could be as simple as adding another worker to process queue messages or even upgrade a database server to a larger instance.
Let’s walk through how this is set up.
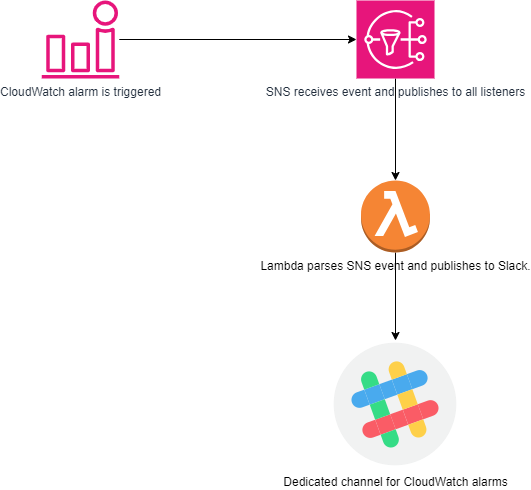
Once an alarm is triggered, it sends an event into SNS. The SNS has one subscriber: a Lambda function that parses the event and publishes a message to Slack. It’s a simple system using common AWS components.
Slack
The first step is to create a dedicated Slack channel to receive the alarms.
- Navigate to your Slack workspace.
- Search for webhook.
- Click Incoming WebHooks.
- Click Add to Slack.
- For the Post to Channel list, select an existing channel or click create a new channel to create a new channel.
- Click Add Incoming WebHooks integration.
The Slack channel is created and the webhook is integrated with the slack channel.
Note: On the Incoming WebHooks page, from the Webhook URL field, copy the webhook URL to use later.
Lambda
Next, you need to create a Lambda function. Here’s an example python one that will notify you when an alarm is triggered, cleared, and created.
    import urllib3
import json

slack_url = "<your Slack webhook>"
http = urllib3.PoolManager()

def get_alarm_attributes(sns_message):
    alarm = dict()

    alarm['name'] = sns_message['AlarmName']
    alarm['description'] = sns_message['AlarmDescription']
    alarm['reason'] = sns_message['NewStateReason']
    alarm['region'] = sns_message['Region']
    alarm['state'] = sns_message['NewStateValue']
    alarm['previous_state'] = sns_message['OldStateValue']

    return alarm


def register_alarm(alarm):
    return {
        "type": "home",
        "blocks": [
            {
                "type": "header",
                "text": {
                    "type": "plain_text",
                    "text": ":information_source: new alarm '" + alarm['name'] + "' was created"
                }
            },
            {
                "type": "divider"
            },
            {
                "type": "section",
                "text": {
                    "type": "mrkdwn",
                    "text": "_" + alarm['description'] + "_"
                },
                "block_id": "text1"
            },
            {
                "type": "divider"
            },
            {
                "type": "context",
                "elements": [
                    {
                        "type": "mrkdwn",
                        "text": "Region: *" + alarm['region'] + "*"
                    }
                ]
            }
        ]
    }


def activate_alarm(alarm):
    return {
        "type": "home",
        "blocks": [
            {
                "type": "header",
                "text": {
                    "type": "plain_text",
                    "text": ":red_circle: CloudWatch Alarm: " + alarm['name'],
                }
            },
            {
                "type": "divider"
            },
            {
                "type": "section",
                "text": {
                    "type": "mrkdwn",
                    "text": "_" + alarm['reason'] + "_"
                },
                "block_id": "text1"
            },
            {
                "type": "divider"
            },
            {
                "type": "context",
                "elements": [
                    {
                        "type": "mrkdwn",
                        "text": "Region: *" + alarm['region'] + "*"
                    }
                ]
            }
        ]
    }


def resolve_alarm(alarm):
    return {
        "type": "home",
        "blocks": [
            {
                "type": "header",
                "text": {
                    "type": "plain_text",
                    "text": ":large_green_circle: OK: " + alarm['name'] + " was resolved (CloudWatch)",
                }
            },
            {
                "type": "divider"
            },
            {
                "type": "section",
                "text": {
                    "type": "mrkdwn",
                    "text": "_" + alarm['reason'] + "_"
                },
                "block_id": "text1"
            },
            {
                "type": "divider"
            },
            {
                "type": "context",
                "elements": [
                    {
                        "type": "mrkdwn",
                        "text": "Region: *" + alarm['region'] + "*"
                    }
                ]
            }
        ]
    }


def lambda_handler(event, context):
    sns_message = json.loads(event["Records"][0]["Sns"]["Message"])
    alarm = get_alarm_attributes(sns_message)

    msg = str()

    if alarm['previous_state'] == "INSUFFICIENT_DATA" and alarm['state'] == 'OK':
        msg = register_alarm(alarm)
    elif alarm['previous_state'] == 'OK' and alarm['state'] == 'ALARM':
        msg = activate_alarm(alarm)
    elif alarm['previous_state'] == 'ALARM' and alarm['state'] == 'OK':
        msg = resolve_alarm(alarm)

    encoded_msg = json.dumps(msg).encode("utf-8")
    resp = http.request("POST", slack_url, body=encoded_msg)
    print(
        {
            "message": msg,
            "status_code": resp.status,
            "response": resp.data,
        }
    )
SNS
Create an SNS topic and add your Lambda as a subscriber.
CloudWatch
You can create your CloudWatch by hand or you can use terraform (and you should) to store your infrastructure as code. Here’s a quick example of how to do that for SQS queue depth.
data "aws_sns_topic" "alert_topic" {
    name = "NAME_OF_YOUR_SNS_TOPIC"
}

resource "aws_cloudwatch_metric_alarm" "sqs_queue_depth_alarm" {
    alarm_name          = "<alarm name>"
    comparison_operator = "GreaterThanOrEqualToThreshold"
    evaluation_periods = 1
    metric_name        = "ApproximateNumberOfMessagesVisible"
    namespace          = "AWS/SQS"
    period             = 60
    statistic          = "SampleCount"
    unit              = "Count"
    threshold          = 100
    alarm_description  = "<message to display>"
    alarm_actions      = [data.aws_sns_topic.alert_topic[0].arn]
    ok_actions         = [data.aws_sns_topic.alert_topic[0].arn]

    dimensions = {
        QueueName = aws_sqs_queue.<your-queue>.name
    }
}
This CloudWatch alarm will trigger when there are 100 messages or more in the queue.
Summary
You can create alerts on anything you dream of, but some things we’ve found handy are SQS queue depth, Postgres CPU and disk space, DynamoDb read/write capacity, and ElastiCache memory and CPU.
Let your imagination run wild and happy monitoring!